Blogging by the numbers
Let’s start the New Year with some numbers! Out of curiosity, I performed some “in-depth data analysis” on my blog. My hope was to get one or two valuable insights into the content I’ve been producing. Without further ado, here’re a handful of beautiful charts for you to enjoy, along with more or less serious comments for better context.
Amount of content
First, I counted how many posts I’ve published since creating this blog in 2012. Here’s the result, broken down by year.
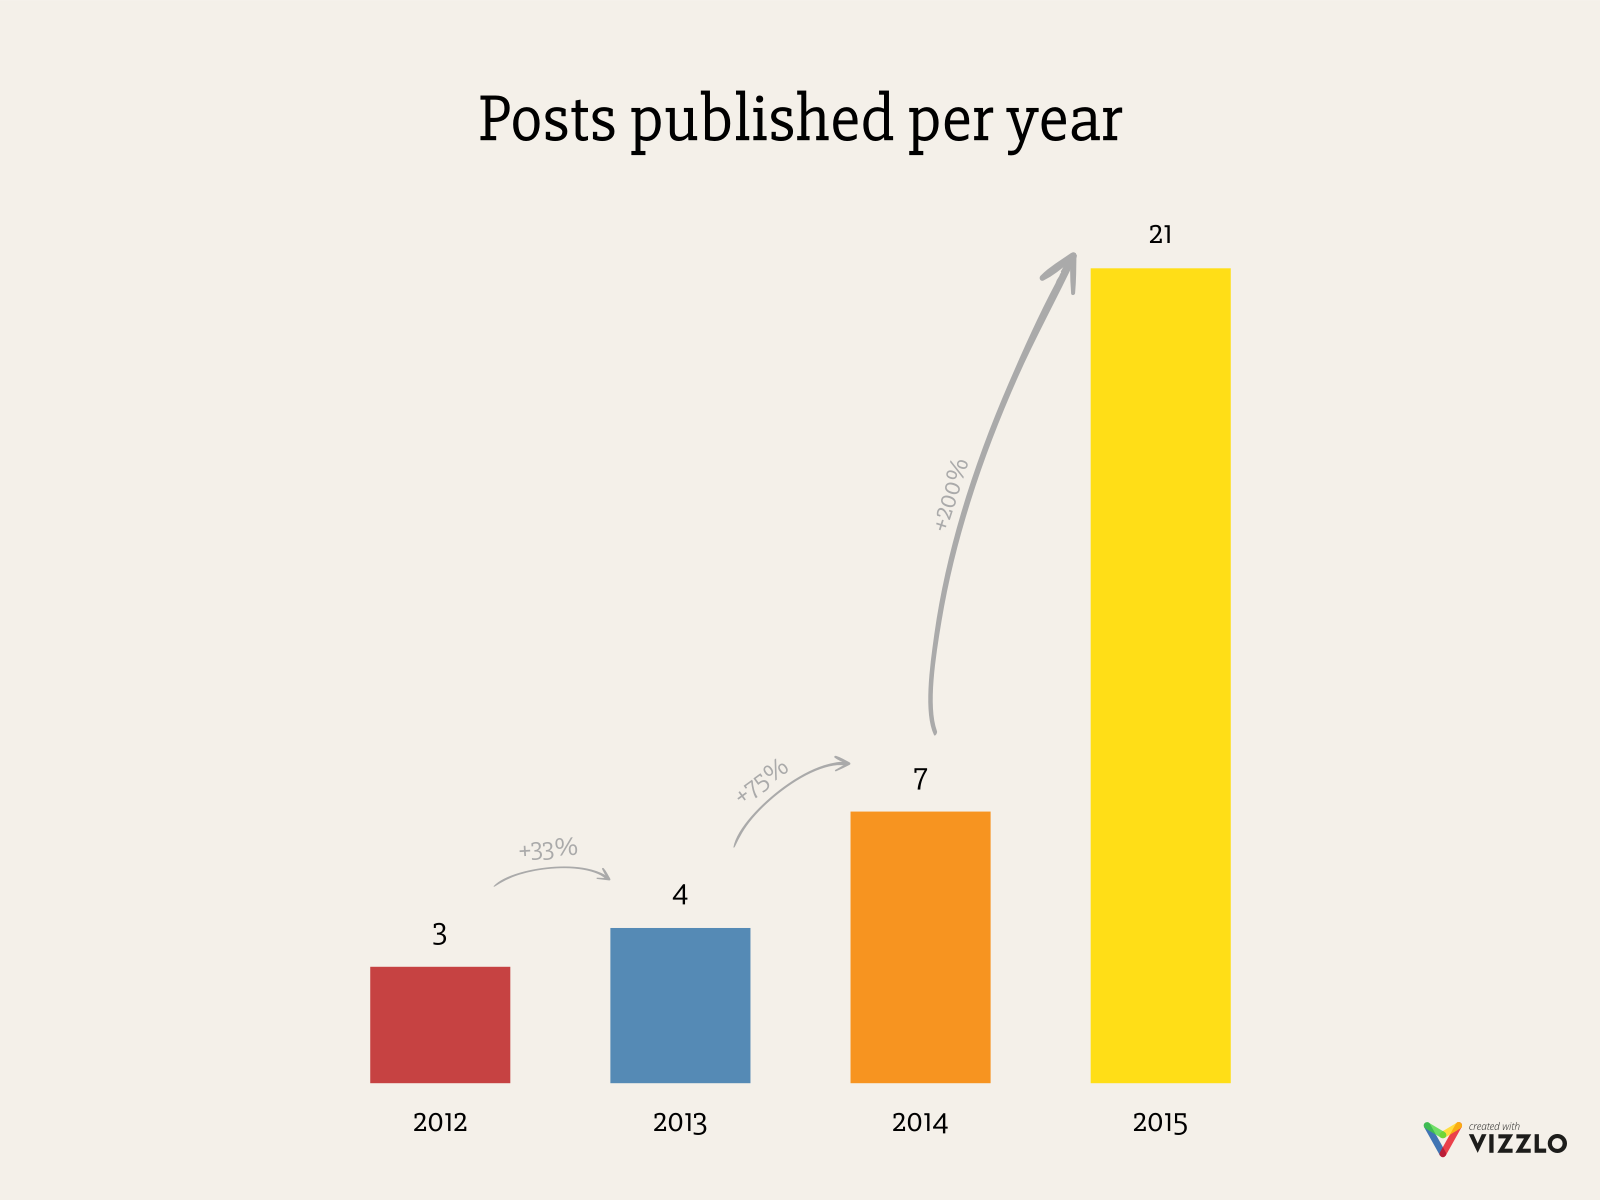
So, in three and a half years (the very first post is from June 2012), I’ve published a total of 35 posts. That’s a bit less than one post per month on average. Looking at the chart above, I’m particularly proud of how 2015 went, as I finally managed to blog on a regular basis – just short of two posts a month.
Next, I wanted to know how many words I’ve put out over the years. (Note that the numbers are just approximations. I used wc -w *.md for counting, which isn’t accurate.)
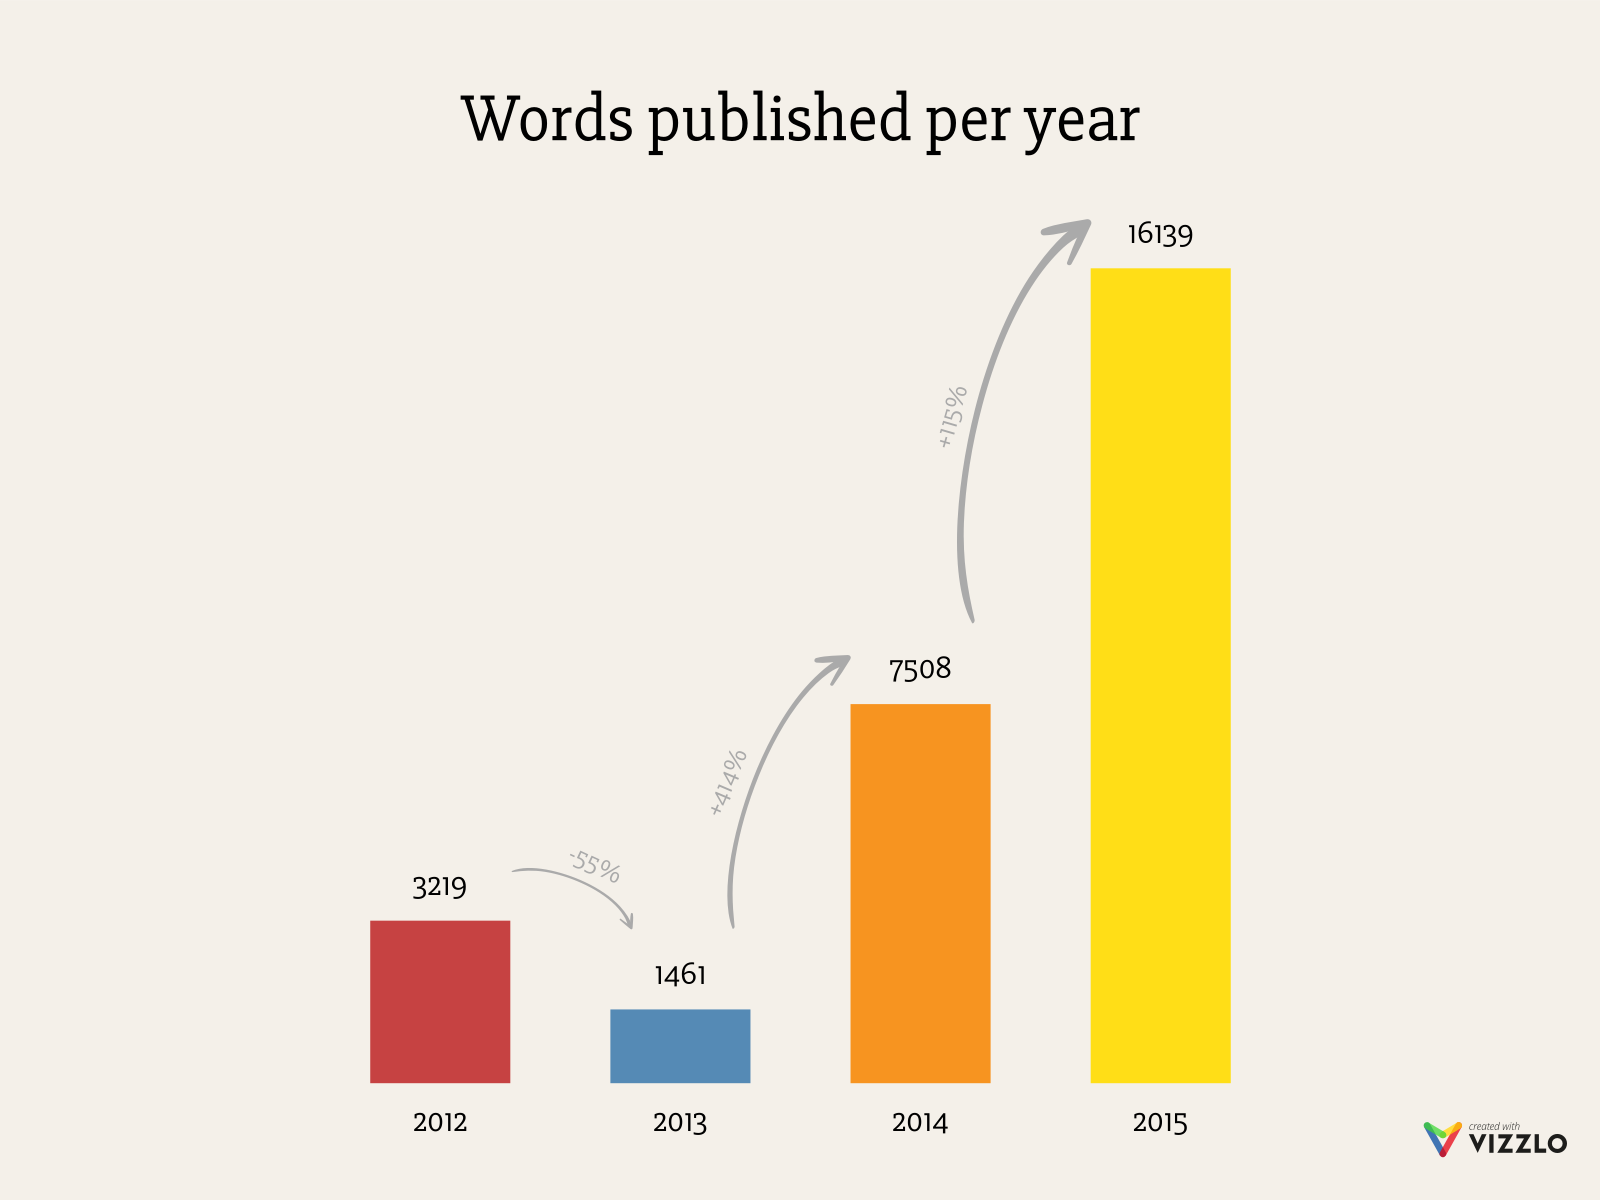
That means I’ve published around 28000 words so far – enough to fill a technical book – with an average of 800 words per post. Let’s not talk about 2013; the word count is embarrassingly low. I do like 2015 a lot more, and I hope to beat that number in 2016!
Topics covered
Moreover, I looked at the tags assigned to each post to get a rough idea of the topics I’ve covered. Again, this isn’t 100% accurate as I chose tags based on gut feeling more than anything else. Anyway, here’s another scientific chart.
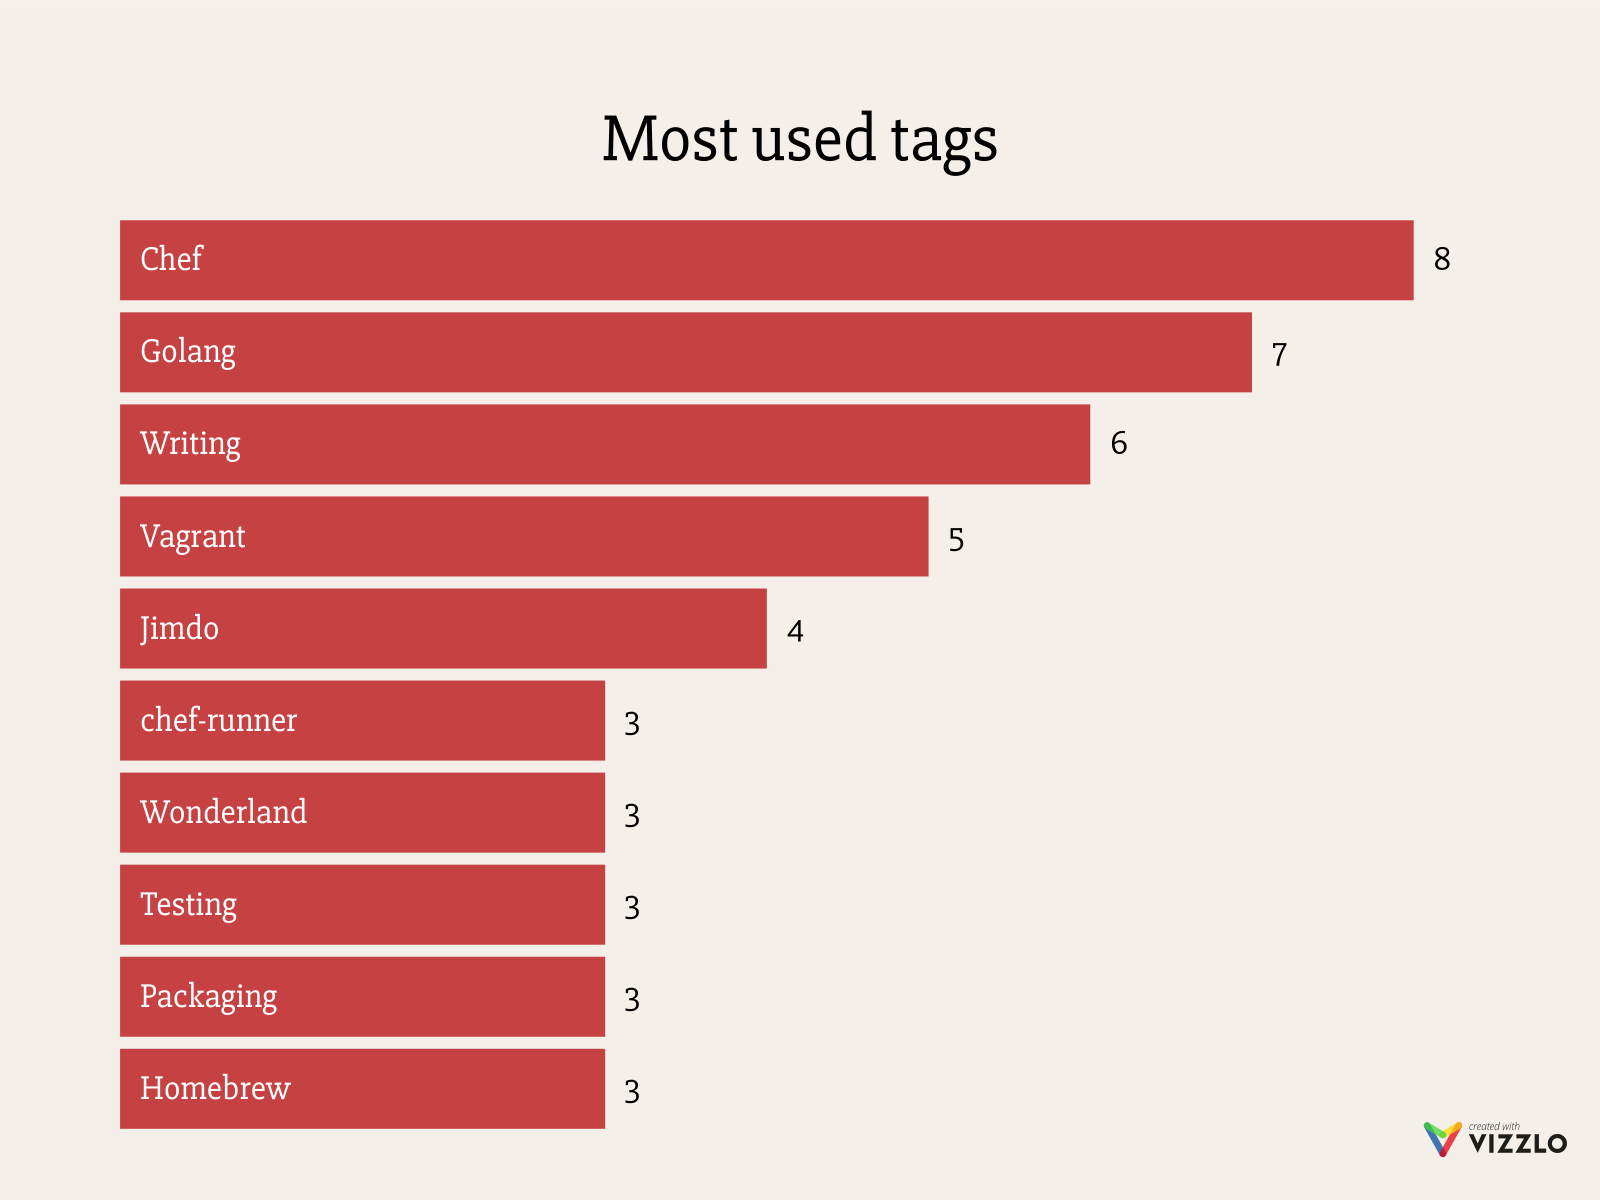
Given this chart and a bit of background information, we can see that I used to be into Chef (and chef-runner), that I’m passionate about Go, and that I like to write about writing. We can also see that Vagrant used to be a thing, that I’m still with Jimdo (currently working on Wonderland, our internal PaaS), that I apparently care about testing and packaging, and that I miss video game hacking a lot.
I like to write about whatever topic appeals most to me at the time, and this chart doesn’t include all of the subjects I covered. Still, I think it’s revealing enough.
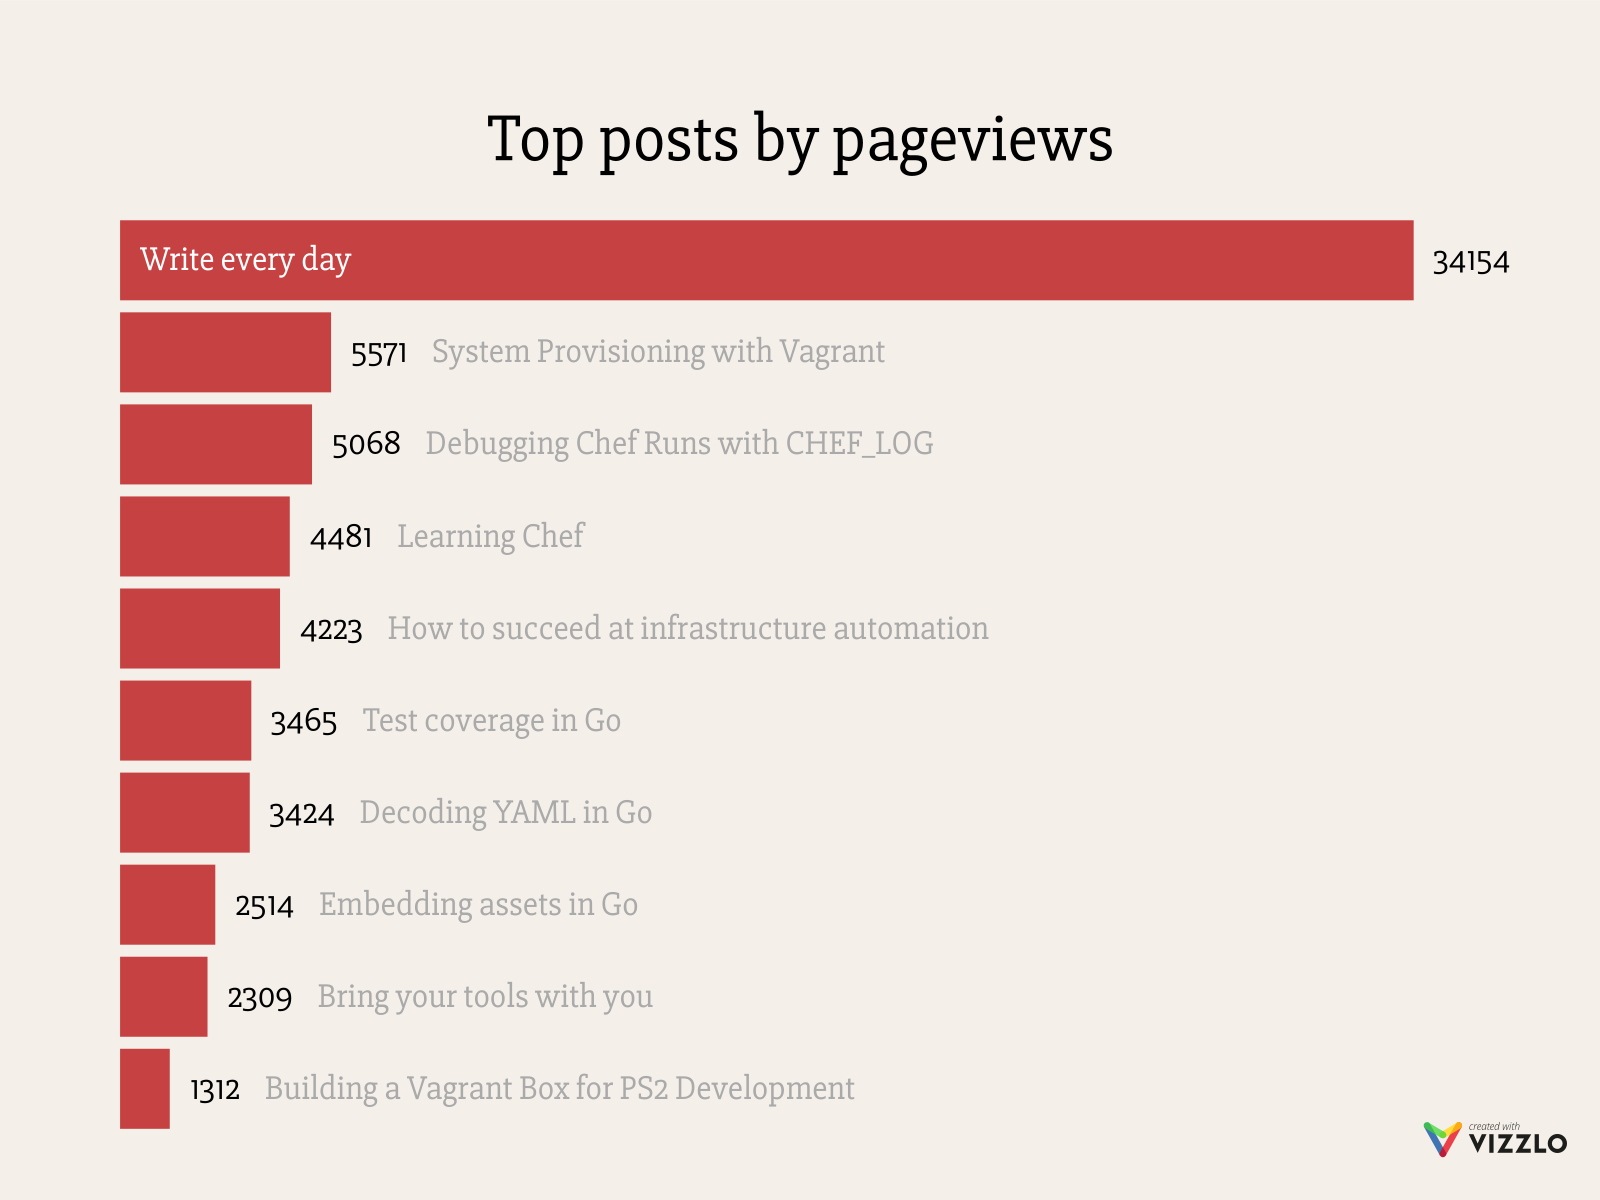
Total pageviews
What would a post about blogging numbers be without some hard pageview statistics? To cut to the chase, here’s a breakdown of total pageviews per year. (There’s no data for 2012 because I started using Google Analytics only in 2013.)
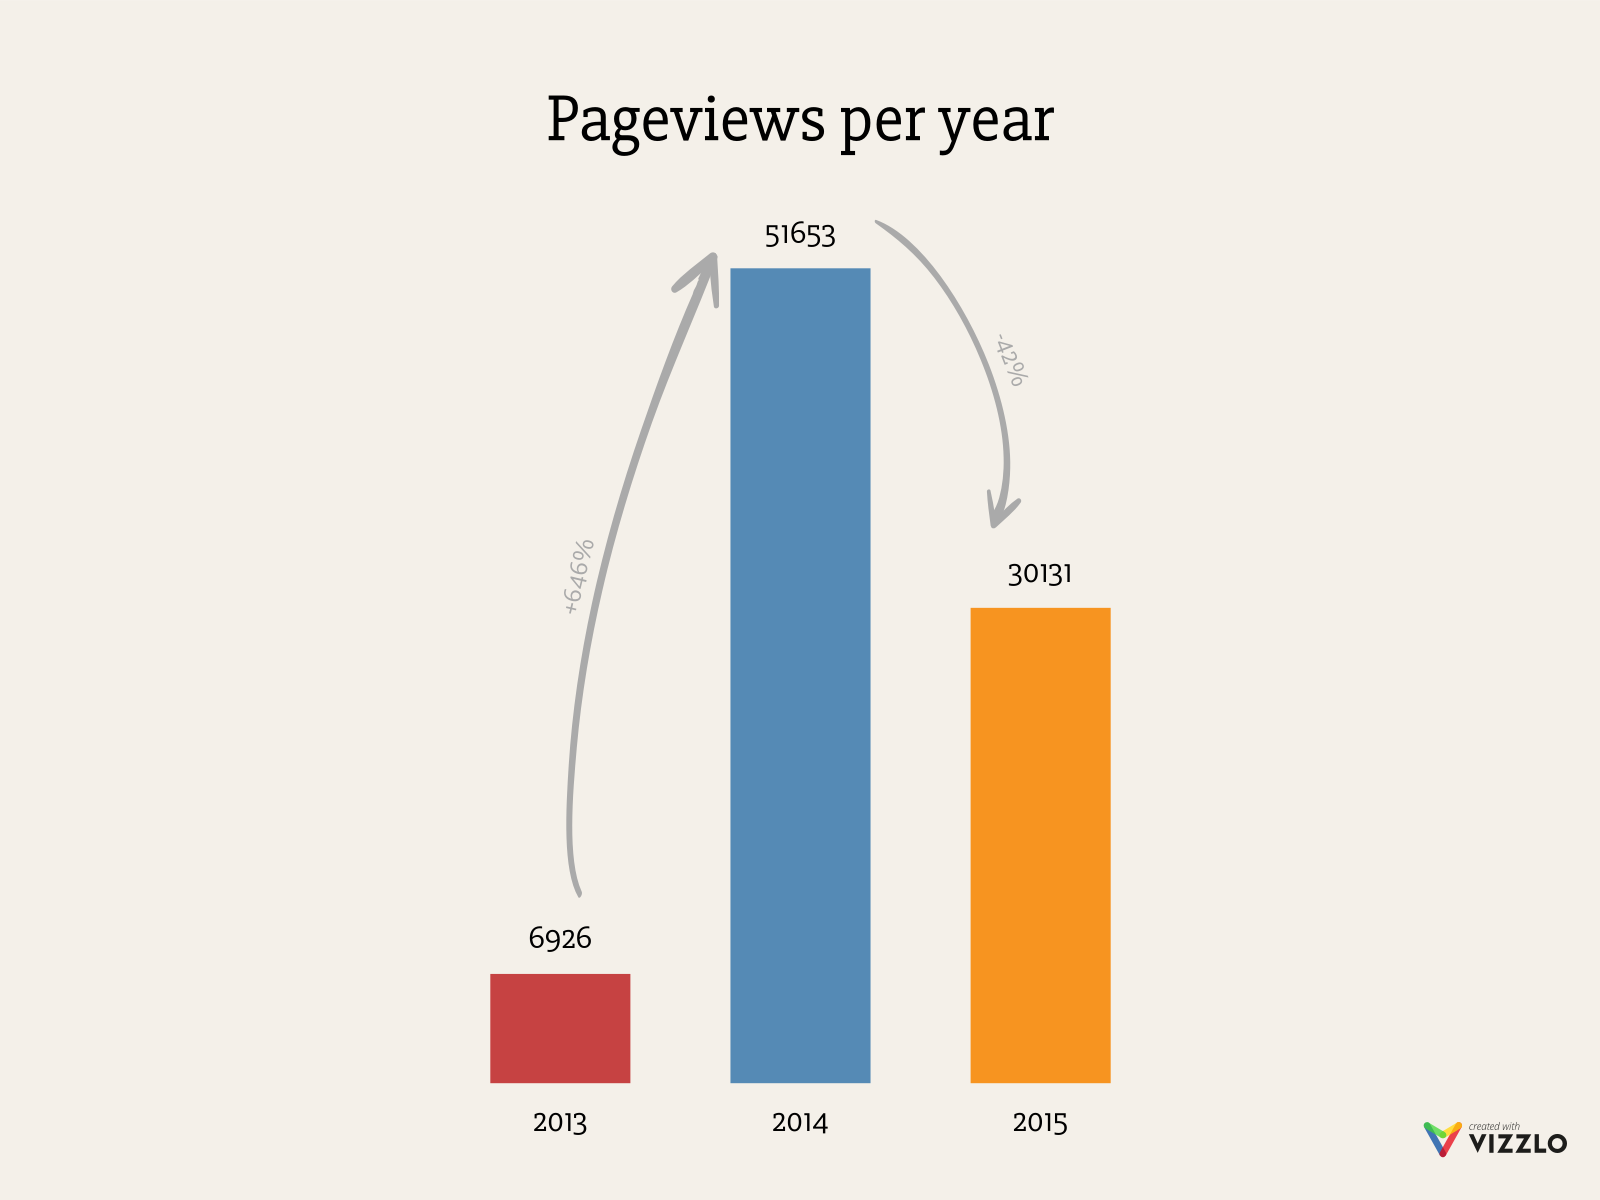
That sums up to almost 89000 pageviews in three years. Due to a lack of data, I can only speculate how many people visited my blog in 2012, but it probably adds up to 100K total pageviews. Not great, but not bad either. I’m aware of the fact that more talented authors easily manage to get that many views with a single article. If that’s you, congratulations! However, I’ve only started aiming for world domination with my writing career…
Looking at the bars, you might wonder how I attracted that comparably large number of visitors in 2014. Well, as it turns out, being #1 on Hacker News for a couple of hours is enough to get 28000 pageviews on a single day! The last chart I want to show you will make it obvious which post I’m talking about. (Remember: I don’t have any data for 2012.)
2016
Over the years, my blog posts were featured multiple times in Devops Weekly and the Go Newsletter, as well as other sites such as Ruby Weekly and the High Scalability blog. (I also wrote a few articles which I didn’t even take into account here.)
In the end, it’s you, dear readers, who literally spread the word. While I find pleasure in writing for its own sake, I would be lying if I said I didn’t care about having and growing a readership. I do look at vanity metrics like pageviews from time to time. But I also know that a blog is nothing without original high-quality content, and I’m committed to produce more of that this year.
Thank you for reading my words. Here’s to an even better 2016!
Shoutout to VIZZLO for making it super easy to create beautiful charts.